Vignette Google Chart (portail)
De Wiki1000
(Différences entre les versions)
| (Une révision intermédiaire par un utilisateur est masquée) | |||
| Ligne 80 : | Ligne 80 : | ||
!Type | !Type | ||
!Style de graphique | !Style de graphique | ||
| − | |||
| − | |||
| − | |||
|- | |- | ||
|bar | |bar | ||
| Ligne 92 : | Ligne 89 : | ||
|pie | |pie | ||
|Camembert | |Camembert | ||
| + | |- | ||
| + | |histogram | ||
| + | |Historique | ||
| + | |- | ||
| + | |areaChart | ||
| + | |Surfaces | ||
| + | |- | ||
| + | |bubbleChart | ||
| + | |Bulles | ||
| + | |- | ||
| + | |candlestickChart | ||
| + | |Bougies | ||
| + | |- | ||
| + | |comboChart | ||
| + | |Séries | ||
| + | |- | ||
| + | |lineChart | ||
| + | |Lignes | ||
| + | |- | ||
| + | |scatterChart | ||
| + | |Points | ||
| + | |- | ||
| + | |steppedAreaChart | ||
| + | |Surfaces | ||
| + | |- | ||
| + | |table | ||
| + | |Table | ||
|- | |- | ||
|calendar | |calendar | ||
| Ligne 98 : | Ligne 122 : | ||
|timeline | |timeline | ||
|Contrôle ligne de temps | |Contrôle ligne de temps | ||
| + | |- | ||
| + | |annotationChart | ||
| + | |Variation | ||
| + | |- | ||
| + | |gauge | ||
| + | |Indicateur | ||
| + | |- | ||
| + | |geoChart | ||
| + | |Carte mondiale | ||
| + | |- | ||
| + | |map | ||
| + | |Carte | ||
| + | |- | ||
| + | |orgChart | ||
| + | |Organisation | ||
| + | |- | ||
| + | |sankey | ||
| + | |Flux | ||
| + | |- | ||
| + | |treeMap | ||
| + | |Arbre | ||
|} | |} | ||
| Ligne 197 : | Ligne 242 : | ||
json.chart.rows[2][1] := Format('1801-02-03',[]); | json.chart.rows[2][1] := Format('1801-02-03',[]); | ||
json.chart.rows[2][2] := Format('1809-02-03',[]);; | json.chart.rows[2][2] := Format('1809-02-03',[]);; | ||
| + | end; | ||
| + | </source> | ||
| + | |||
| + | ===Map=== | ||
| + | [[image:portal-googlechart-map.png]] | ||
| + | |||
| + | <source lang="delphi"> | ||
| + | //Procedure map(req:Tjson; var resp:TObject); | ||
| + | var json:TJson; | ||
| + | begin | ||
| + | json := Tjson.Create(''); | ||
| + | resp := json; | ||
| + | |||
| + | json.chart.cols[0].type := 'string'; | ||
| + | json.chart.cols[0].id := 'address'; | ||
| + | json.chart.cols[1].type := 'number'; | ||
| + | json.chart.cols[1].id := 'rate'; | ||
| + | json.chart.rows[0][0] := '17 rue Fructidor,Paris,France'; | ||
| + | json.chart.rows[0][1] := 100; | ||
end; | end; | ||
</source> | </source> | ||
Voir aussi : | Voir aussi : | ||
| + | * [[Vignette Google Map (portail)|Vignette Google Map]] | ||
* [https://google-developers.appspot.com/chart/ Google Chart] | * [https://google-developers.appspot.com/chart/ Google Chart] | ||
[[Category:Portail]] | [[Category:Portail]] | ||
Version actuelle en date du 4 juin 2014 à 15:44
Sommaire |
Cette vignette affiche un graphique Google Chart à partir d'une source de données JSON.
Paramètres
Paramètres standards :
| Paramètre | Type | Usage |
|---|---|---|
| Titre | string | Titre de la vignette |
| Affichage de la bordure de la vignette | boolean | Une bordure encadrant la vignette est affichée. |
| Afficher l'entête de la vignette | boolean | L'entête de la vignette est affichée. |
| Hauteur | Entier | Hauteur de la vignette en pixels |
| Intervalle de rafraichissement | Entier | Intervalle de rafraichissement automatique de la vignette |
Paramètres spécifiques :
| Paramètre | Type | Usage |
|---|---|---|
| URI | URL | Source de données JSON |
| src | URL | URL de la page HTMl du contenu de l'iframe |
| options | string | Options du graphique Google |
- Source de données (URI)
Adresse de la source de données retournant les données du graphique.
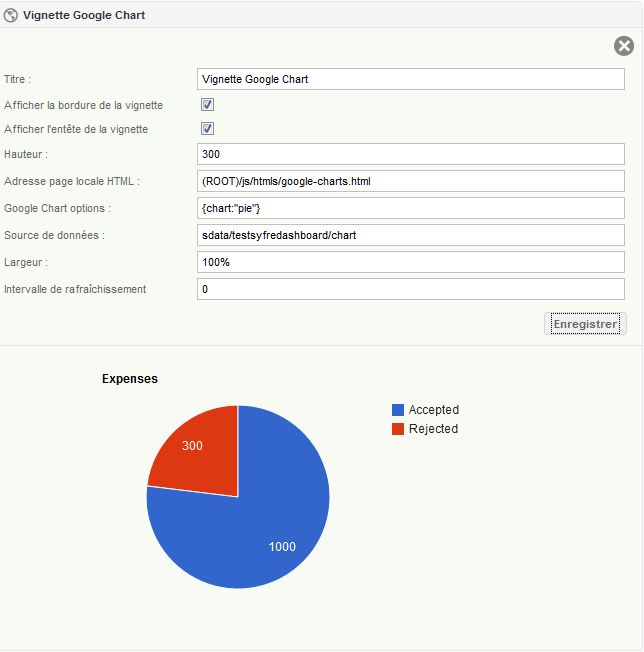
Une source de données de graphique est une structure JSON du type :
{
   "chart":{
      "options":{
         "title":"Expenses",
         "pieSliceText":"value"
      },
      "cols":[
         {
            "name":"Status",
            "type":"string"
         },
         {
            "name":"Amount",
            "type":"number"
         }
      ],
      "rows":[
         [
            "Accepted",
            1000.0
         ],
         [
            "Rejected",
            300.0
         ]
      ]
   }
}
- Adresse page locale HTML (src)
Adresse de la page contenant le code permettant d'incorporer le graphique.
La page fournit par défaut permet de gérer les types de graphique standards.
- Google chart options (options)
Structure JSON permettant de sélectionner les options du graphique
Les options sont la combinaison des options défini dans les propriétés de la vignette et des options retournées par la source de données.
Type de graphique
Les types de graphique supportés sont :
| Type | Style de graphique |
|---|---|
| bar | Barres horizontales |
| columnChart | Barres verticales |
| pie | Camembert |
| histogram | Historique |
| areaChart | Surfaces |
| bubbleChart | Bulles |
| candlestickChart | Bougies |
| comboChart | Séries |
| lineChart | Lignes |
| scatterChart | Points |
| steppedAreaChart | Surfaces |
| table | Table |
| calendar | Contrôle calendrier |
| timeline | Contrôle ligne de temps |
| annotationChart | Variation |
| gauge | Indicateur |
| geoChart | Carte mondiale |
| map | Carte |
| orgChart | Organisation |
| sankey | Flux |
| treeMap | Arbre |
| Tip : Pour supporter d'autre type de graphique il est nécessaire d'utiliser une page HTML google-charts.html personnalisée pour inclure les nouvelles librairies |
Exemples
Pie
Procedure services.chart(req:Tjson; var resp:TObject);
//Procedure chart(req:Tjson; var resp:TObject);
var json:TJson;
begin
  json := Tjson.Create('');
  resp := json;
  json.chart.options.title := 'Expenses';
  json.chart.options.pieSliceText := 'value';
  //
  json.chart.cols[0].name := 'Status';
  json.chart.cols[0].type := 'string';
  json.chart.cols[1].name := 'Amount';
  json.chart.cols[1].type := 'number';
  //
  json.chart.rows[0][0] := 'Accepted';
  json.chart.rows[0][1] := 1000.00;
  json.chart.rows[1][0] := 'Rejected';
  json.chart.rows[1][1] := 300.00;
end;
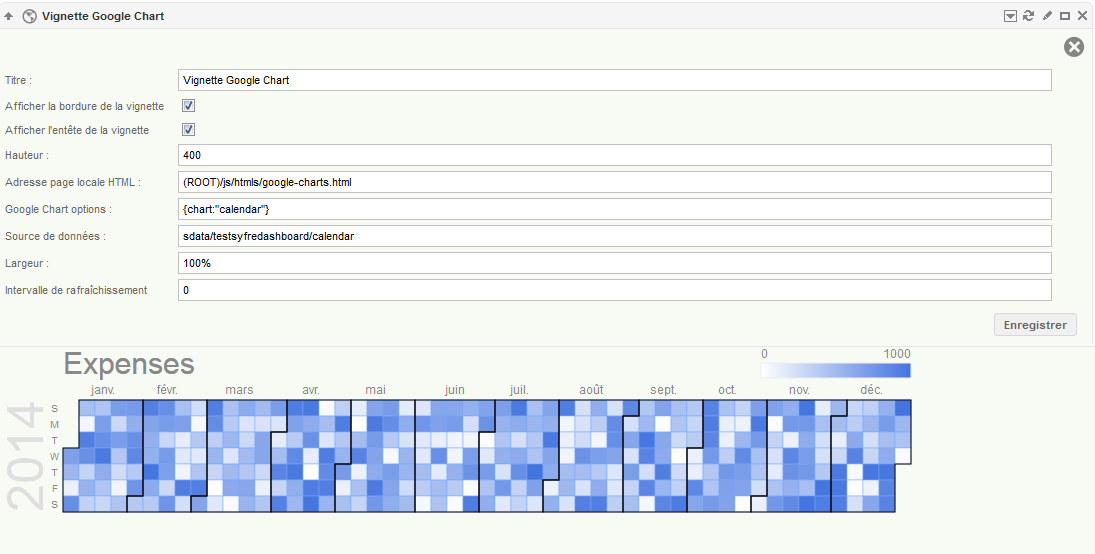
Calendar
//Procedure calendar(req:Tjson; var resp:TObject);
var json:TJson; day,idm,idx:Integer;
begin
  json := Tjson.Create('');
  resp := json;
  //
  json.chart.options.title := 'Expenses';
  json.chart.options.calendar.cellColor.stroke := '#76a7fa';
  json.chart.options.calendar.cellColor.strokeOpacity := 0.5;
  json.chart.options.calendar.cellColor.strokeWidth := 1;
  //
  json.chart.options.calendar.focusedCellColor.stroke := '#d3362d';
  json.chart.options.calendar.focusedCellColor.strokeOpacity := 1;
  json.chart.options.calendar.focusedCellColor.strokeWidth := 1;
  //
  json.chart.cols[0].type := 'date';
  json.chart.cols[0].id := 'Date';
  json.chart.cols[1].type := 'number';
  json.chart.cols[1].id := 'Amount';
  //
  Randomize;
  day := 0;
  for idm:=1 to 12 do
  for idx:=0 to 30 do
   begin
     json.chart.rows[day][0] := Format('2014-%0.02d-%0.02d',[idm,1+idx]);
     json.chart.rows[day][1] := Random(1000);
     day := day+1;
   end;
end;
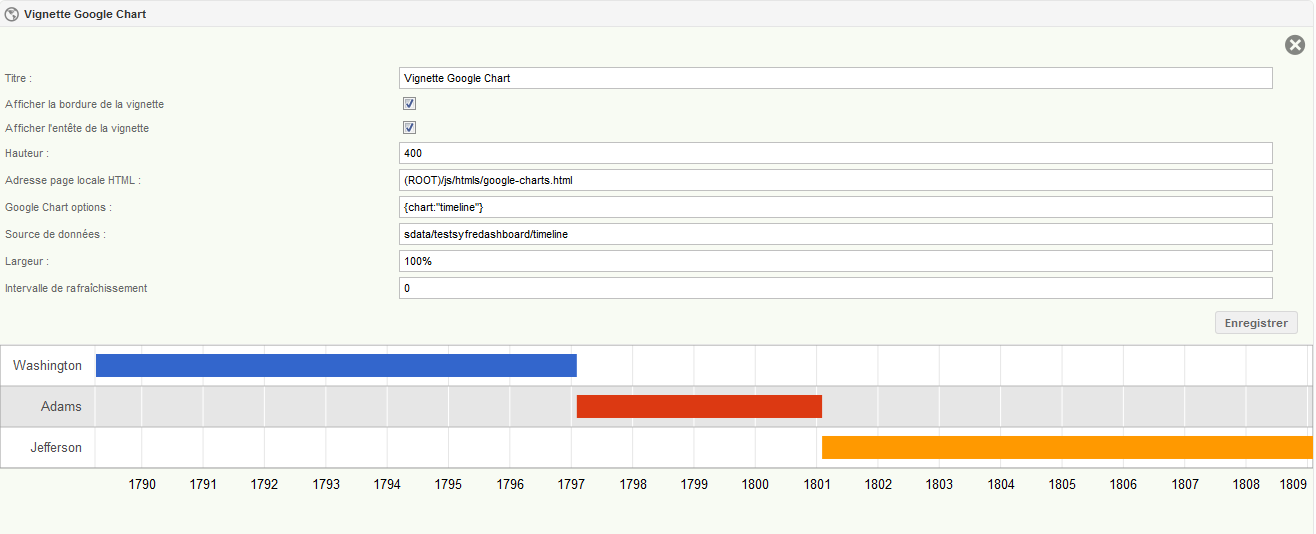
Timeline
//Procedure timeline(req:Tjson; var resp:TObject);
var json:TJson;
begin
  json := Tjson.Create('');
  resp := json;

  json.chart.options.title := 'Expenses';
  //
  json.chart.cols[0].type := 'string';
  json.chart.cols[0].id := 'President';
  json.chart.cols[1].type := 'date';
  json.chart.cols[1].id := 'Start';
  json.chart.cols[2].type := 'date';
  json.chart.cols[2].id := 'End';
  //
  json.chart.rows[0][0] := 'Washington';
  json.chart.rows[0][1] := Format('1789-03-29',[]);
  json.chart.rows[0][2] := Format('1797-02-03',[]);;
  //
  json.chart.rows[1][0] := 'Adams';
  json.chart.rows[1][1] := Format('1797-02-03',[]);
  json.chart.rows[1][2] := Format('1801-02-03',[]);;
  //
  json.chart.rows[2][0] := 'Jefferson';
  json.chart.rows[2][1] := Format('1801-02-03',[]);
  json.chart.rows[2][2] := Format('1809-02-03',[]);;
end;
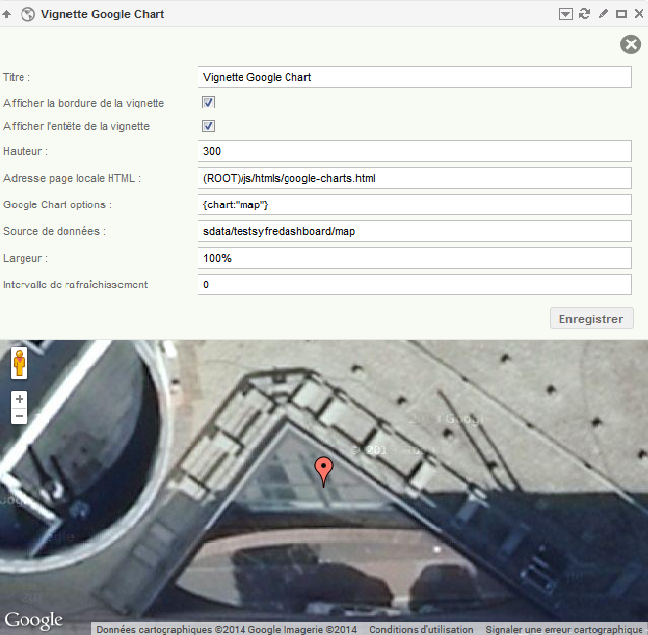
Map
//Procedure map(req:Tjson; var resp:TObject);
var json:TJson;
begin
  json := Tjson.Create('');
  resp := json;

  json.chart.cols[0].type := 'string';
  json.chart.cols[0].id := 'address';
  json.chart.cols[1].type := 'number';
  json.chart.cols[1].id := 'rate';
  json.chart.rows[0][0] := '17 rue Fructidor,Paris,France';
  json.chart.rows[0][1] := 100;
end;
Voir aussi :
| Whos here now: Members 0 Guests 0 Bots & Crawlers 2 |


